2024年4月20日 星期六

「電價貴不貴」之哪種圖最適合你的資料視覺化?

在臉書上看到一張圖: 比較一些國家的薪資中位數 vs 電價。 忍不住想用 scatplot 重畫一次。 我詢問資料出處, 可惜原繪圖者沒回答。 只搜尋到 "World Population Review" 的這兩頁: Median Income by CountryCost of Electricity by Country。 點表格右上方的 "csv" 即可索取、 從 email 收到 inc.csvec.csv 這兩個 csv 檔。 用我的小程式 country-encode.py 幫兩檔各自加上 iso 三碼國碼、 依國碼排序、 用 join 合併、 用 libreoffice calc 打開、 手動整理一些小地方, 最後得到 inc-ec.csv。 再搭配 inc-ec.json 設定檔, 畫出 「電價 vs 收入中位數」 互動氣泡圖。 <== 點我!

大家可以比較一下這兩張圖, 何者比較容易閱讀? 在此例當中, 我們所關心的是 「電價/收入中位數」 這個比值。 在原來的長條圖當中, 不是很容易辨識、比較; 在散點圖/氣泡圖當中, 正好是斜率。 散點圖/氣泡圖也比長條圖更能夠同時放下許多國家。

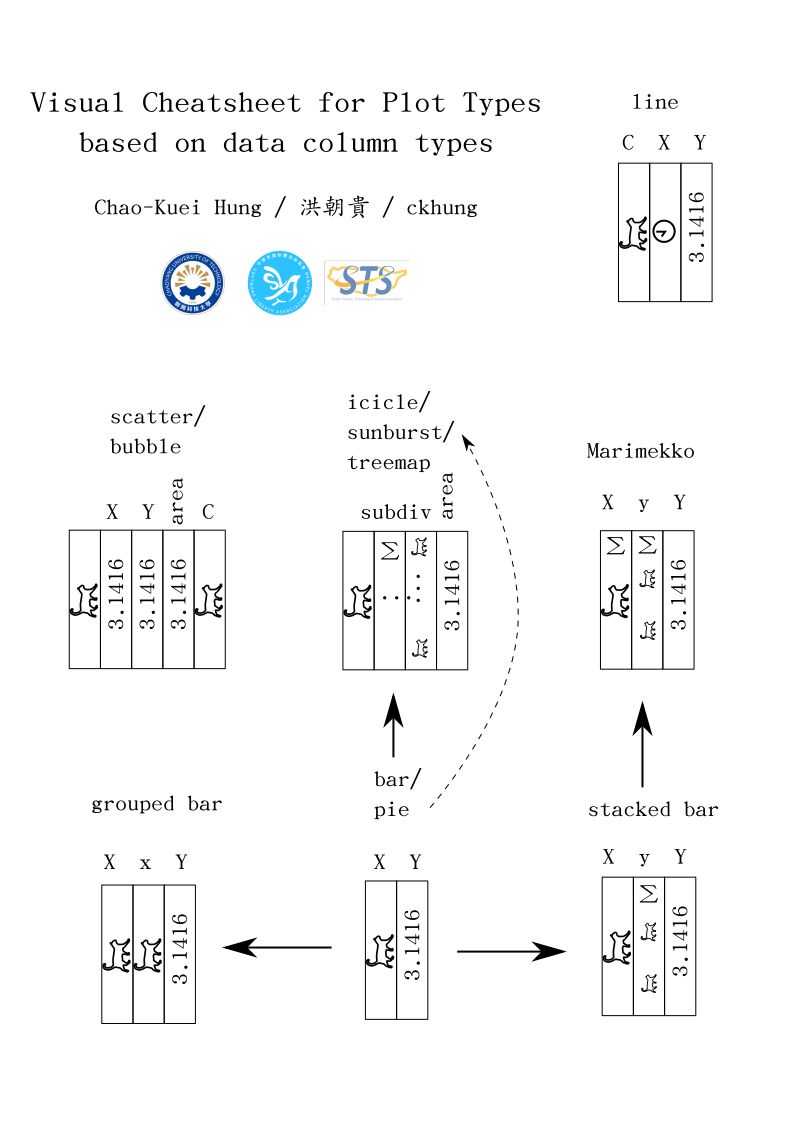
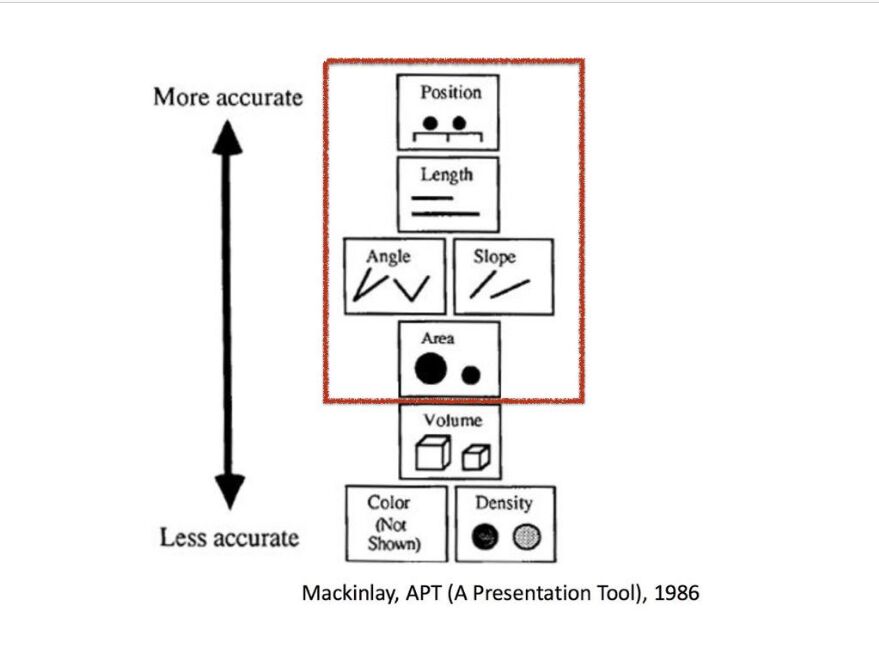
因為 World Population Review 的資料來自不同的年度, 所以我所繪製的圖無法精確地反應事實。 這篇文章的目的並不是討論台灣的電價貴不貴, 而是要告訴大家: 資料視覺化的工具並不難操作; 重點是你要知道該選哪一種圖、 該把資料的哪個欄位對應到圖的哪個參數, 才最能夠清楚地表達你的訴求。 在這個注意力缺稀的年代, 公司的行銷、 政黨政績的呈現、 科普知識推廣、 破解假消息、... 之類各種需要說服群眾的工作, 這個能力非常重要。 (請找我去演講吧! 貴哥退休後的 「求兼職公開信」) 我的英文文章 Visual Cheatsheet for Plot Types Based on Data Column Types 有更多提示; 下方第三張圖是該文摘要。 (當時在教國際班, 所以有些文章用英文寫。 現在沒再貼新的英文文章了。) 最右邊那張圖則是 Mackinlay 在解釋人眼對於不同的視覺變數 (visual variables) 的敏感度; 它也說明了為何很多時候散點圖/氣泡圖是最佳選擇。

* * * * *

[2025/1/1] (借這裡放上課講義, 在中興大學上通識課要用的例子)

上面的例子說明: 當你有興趣的數值欄位之間有這樣的關係時: c = a / b 散點圖正好可以用 X 與 Y 兩軸同時呈現三個欄位, 把圓圈大小留給第四個數值欄位。 另一個例子是 14 家公司的機車強制險比較表

wget https://polida.com.tw/post/motorcycle-insurance-comparison -O insurance.html
html2csv.py insurance.html
html2csv.py insurance.html | less
# 按 q 離開
html2csv.py insurance.html | wc
html2csv.py insurance.html | tail -n 20
html2csv.py insurance.html | tail -n 20 > insurance.csv
nano insurance.csv
# 去除多餘的列, 並把標題列改成:
# company,complaint,total,rate

再用 nano 建一個新的檔案 insurance.json 並且把以下內容貼進去:

{
  "source": {
    "csv": "mo-ins/motorcycle-insurance.csv",
    "textcols": ["company"],
    "pkey": "company"
  },
  "plotly": {
    "layout": {
      "title": "機車保險簽單契約總件數 (total) vs 申訴件數 (complaint)"
    },
    "maintrace": {
      "xaxis": { "expr": "total" },
      "yaxis": { "expr": "complaint" },
      "size": { "expr": "20" },
      "maintext": "",
      "hovertext": "company"
    }
  }
}

再來, 下載 scatplot、 建一個目錄, 把剛剛那兩個檔案放進去:

wget -O ~/scatplot.zip https://github.com/ckhung/scatplot/archive/refs/heads/master.zip
unzip -v ~/scatplot.zip
cd ~/public_html
unzip ~/scatplot.zip
mv scatplot-master scatplot
cd scatplot/
mkdir mo-ins
cp ~/insurance.* mo-ins/
ls -l mo-ins/

然後用瀏覽器查看: http://.../~s411xxxxxxx/scatplot/?c=mo-ins/insurance.json

沒有留言:

張貼留言

因為垃圾留言太多,現在改為審核後才發佈,請耐心等候一兩天。